What is the best way to include data from multiple data sources in one panel?
Which data sources would be used to provide end-user experience monitoring? (Select 2)
Which instruments can display threshold status? (Select 2)
Where is the "Embeddable HTML" field found in the Dashboard user interface?
When you type an IP address or host name in the search field of Riverbed Performance Management Dashboards, the following occurs:
Which Riverbed Performance Management solution leverages the same packet collection as AppResponse Xpert but looks deep into SQL performance and usage without agents?
Which methods would diagnose why page views are not being counted in BrowserMetrix? (Select 3)
Which Riverbed Performance Management solution would be appropriate for companies seeking application code-level tracing and high-level performance monitoring?
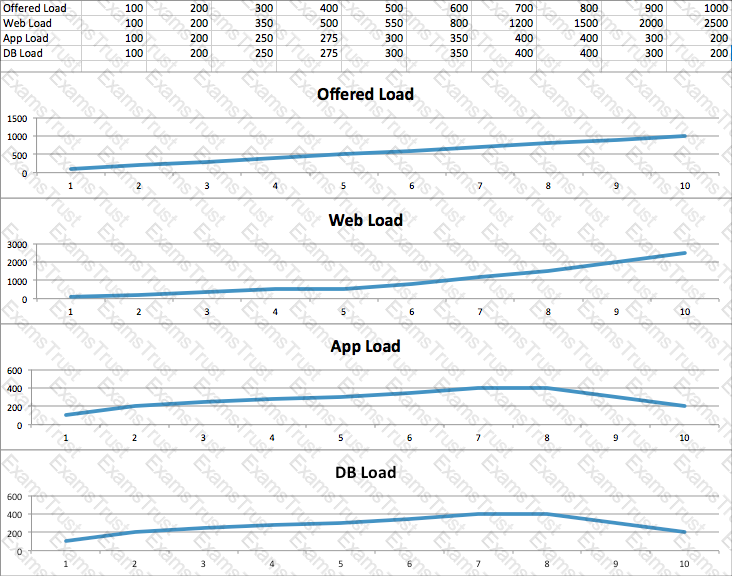
Refer to the exhibit.

This graph represents the number of requests waiting for a response across various tiers. With load being generated at a constantly increasing rate, which tier is the bottleneck and why?
In a three-tier application with a web front-end, application middle tier, and database back-end, where is the best instrumentation point for end-to-end visibility?
The AppInternals Xpert Transaction Trace Warehouse can extract usernames from transactions:
With AppInternals Xpert, how are SQL queries captured?
What useful information can you get from AppResponse Xpert (ARX) database browsing insights? (Select 3)
What is the maximum number of transactions stored by Transaction Trace Warehouse (TTW)?
What granularity of data is available on the Service Management Platform (SMP)? (Select 2)
What is the default filter name used when importing a trace in transaction analyzer?
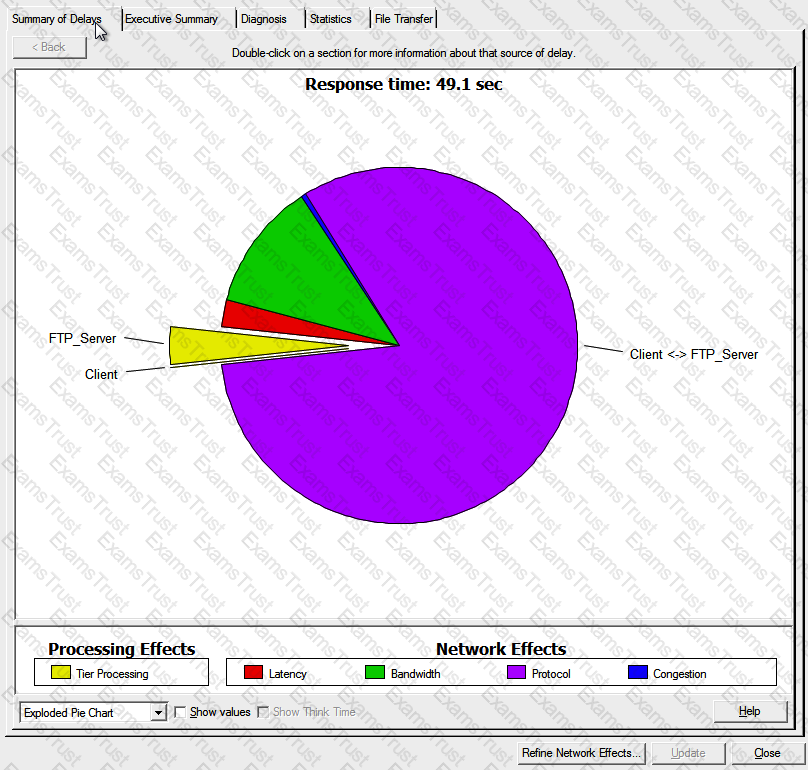
Refer to the exhibit from the AppDoctor.

The primary bottleneck is probably due to:
What default time does AppTransaction Xpert use to detect user think time?
Which of these would you use to determine how varying latencies, bandwidths, and other network parameters affect an application transaction's performance?
AppDoctor's Summary of Delays divides the total application response time into the following categories:
For BrowserMetrix, the "time to first byte" and "download and render" time is considered:
Which of these are not available to instrument a web application with BrowserMetrix?
How can you change the AppResponse Xpert BrowserMetrix default web user interface communication ports?
Each of the "dots" you see in the BrowserMetrix user interface represent:
Safari seems to outperform other browsers in its response time report. Why is its "time to first byte" so much shorter than other browsers? (Select 2)
What metric is used to check if web transaction analysis (WTA) is not overloaded with too much traffic to monitor?
Which performance layers which make up the user response time curve in the Response Time Composition Chart (RTCC)? (Select 4)
A TCP turn in AppResponse Xpert is defined as:
The snapshot buffer is used for: